With this simple example we will learn how to use Cloudwatch to monitor any kind of information generated inside our EC2 instance. Cloudwatch is ready to monitor metrics that can be obtained from the outside (CPU, Network and EBS I/O) but it needs some help to get into our machine.
We need:
- Apache HTTP server installed and running with the module mod_status installed and activated. Here the mod_status documentation.
- Previous knowledge to interact with AWS Cloudwatch monitoring API and a working AWS_CREDENTIAL_FILE. You can use this previous article for help.
Test mod_status configuration:
- Access to the "Apache Server Status" page using a browser. URL: http://(you-web-server-public-DNS)/server-status and you should see something like this:
Apache Server Status for ec2-107-22-47-235.compute-1.amazonaws.com
_____W__........................................................
................................................................
................................................................
................................................................
Scoreboard Key: " _" Waiting for Connection, "S" Starting up, "R" Reading Request," W" Sending Reply, "K" Keepalive (read), "D" DNS Lookup," C" Closing connection, "L" Logging, "G" Gracefully finishing," I" Idle cleanup of worker, "." Open slot with no current processPID Key: 1156 in state: _ , 1158 in state: _ , 1159 in state: _ 1160 in state: _ , 1161 in state: _ , 1162 in state: W 1163 in state: _ , 1164 in state: _ , To obtain a full report with current status information you need to use the ExtendedStatus On directive.Apache/2.2.23 (Amazon) Server at ec2-107-22-47-235.compute-1.amazonaws.com Port 80 |
We will use a shorter output call to make scripting easier. URL: http://(you-web-server-public-DNS)/server-status?auto (The same as before but with "?auto" at the end). The output is like this:
BusyWorkers: 1IdleWorkers: 7 Scoreboard: __W_____....................................................................... |
Security Note: For a production environment you should restrict the access to mod_status only to calls accessing the server listening at localhost (127.0.0.1).
The script:
The script:
| #!/bin/bash logger "Apache Status Started" export AWS_CREDENTIAL_FILE=/opt/aws/apitools/mon/credential-file-path.template export AWS_CLOUDWATCH_HOME=/opt/aws/apitools/mon export AWS_IAM_HOME=/opt/aws/apitools/iam export AWS_PATH=/opt/aws export AWS_AUTO_SCALING_HOME=/opt/aws/apitools/as export AWS_ELB_HOME=/opt/aws/apitools/elb export AWS_RDS_HOME=/opt/aws/apitools/rds export EC2_AMITOOL_HOME=/opt/aws/amitools/ec2 export EC2_HOME=/opt/aws/apitools/ec2 export JAVA_HOME=/usr/lib/jvm/jre export PATH=/usr/local/sbin:/usr/local/bin:/sbin:/bin:/usr/sbin:/usr/bin:/opt/aws/bin:/root/bin SERVER=`wget -q -O - http://169.254.169.254/latest/meta-data/instance-id` BUSYWORKERS=`wget -q -O - http://localhost/server-status?auto | grep BusyWorkers | awk '{ print $2 }'` IDLEWORKERS=`wget -q -O - http://localhost/server-status?auto | grep IdleWorkers | awk '{ print $2 }'` /opt/aws/bin/mon-put-data --metric-name httpd-busyworkers --namespace "EC2: HTTPD" --dimensions "InstanceId=$SERVER" --unit Count --value $BUSYWORKERS /opt/aws/bin/mon-put-data --metric-name httpd-idleworkers --namespace "EC2: HTTPD" --dimensions "InstanceId=$SERVER" --unit Count --value $IDLEWORKERS logger "Apache Status Ended with $SERVER $BUSYWORKERS $IDLEWORKERS" |
First, we load all the environment variables that could be used in the exercise (and others). We expect to use this script with crontab so the more the better. Then we load SERVER with the instance name obtained from EC2 Instance Metadata to identify this metric into the Cloudwatch cloud. Now we load BUSYWORKERS and IDLEWORKERS with its values obtained from Apache mod_status using a wget call. The command mon-put-data does the magic to insert those two metrics into Cloudwatch.
Save the script and execute it 3 or 4 times from command line to be sure that it works and to create some results to play with. At your system log you should see something like this:
| # tail /var/log/messages Nov 2 11:10:01 ip-10-29-30-54 root: Apache Status Started Nov 2 11:10:04 ip-10-29-30-54 root: Apache Status Ended with i-87eef4e1 1 7 Nov 2 11:15:01 ip-10-29-30-54 root: Apache Status Started Nov 2 11:15:04 ip-10-29-30-54 root: Apache Status Ended with i-87eef4e1 5 4 Nov 2 11:20:01 ip-10-29-30-54 root: Apache Status Started Nov 2 11:20:04 ip-10-29-30-54 root: Apache Status Ended with i-87eef4e1 5 6 Nov 2 11:25:01 ip-10-29-30-54 root: Apache Status Started Nov 2 11:25:04 ip-10-29-30-54 root: Apache Status Ended with i-87eef4e1 5 7 |
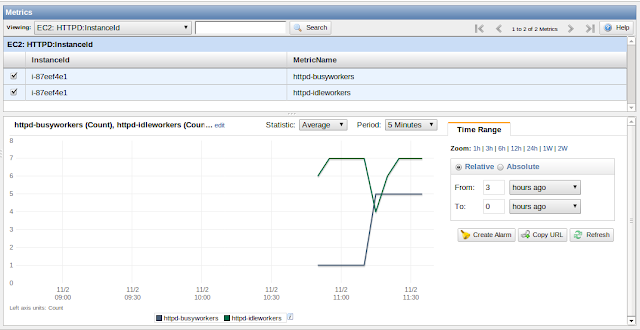
Now we can go to locate our new metrics in Cloudwatch. Open Cloudwatch console. On the left menu "Navigation" click "All Metrics". Then on "Metrics Viewing" select on the pull-down "EC2: HTTPD:IntanceId". Two metrics are shown then. Under your EC2 Instace ID should be present httpd-busyworkers and httpd-idleworkers. Select both metrics and Cloudwatch should create a graphic similar to this:
Note: New metrics in Cloudwatch could take some minutes to consolidate and to be present on the console. If after a while they do not appear, close your AWS Console, open it again and notice whether the value "Cloud Metrics Available" at your Cloudwatch Console Dashboard has increased. Also note that by default all the API interaction are directed to the us-east-1 Region (N.Virginia). Be sure you have selected that region on your console.With our script tested we could easily create a crontab entry to execute it every 5 minutes. Create a crontab entry like this using your script path and name.
| # crontab -l */5 * * * * /root/apache-server-status.sh |
Note: Using AWS Cloudwatch may occur in some costs. Visit product pricing page for details.
The best way to find out if our crontab configuration is running is to check /var/log/messages file and watch for the script activity every 5 minutes. Now we have a custom metric extracting monitoring information from our application and storing it in Cloudwatch. You could easily configure alarms and notifications using the AWS Console or use those metrics as trigger for an auto scaling group.
Ah! Remember that all data stored in Cloudwatch is deleted after 15 days.


No comments:
Post a Comment